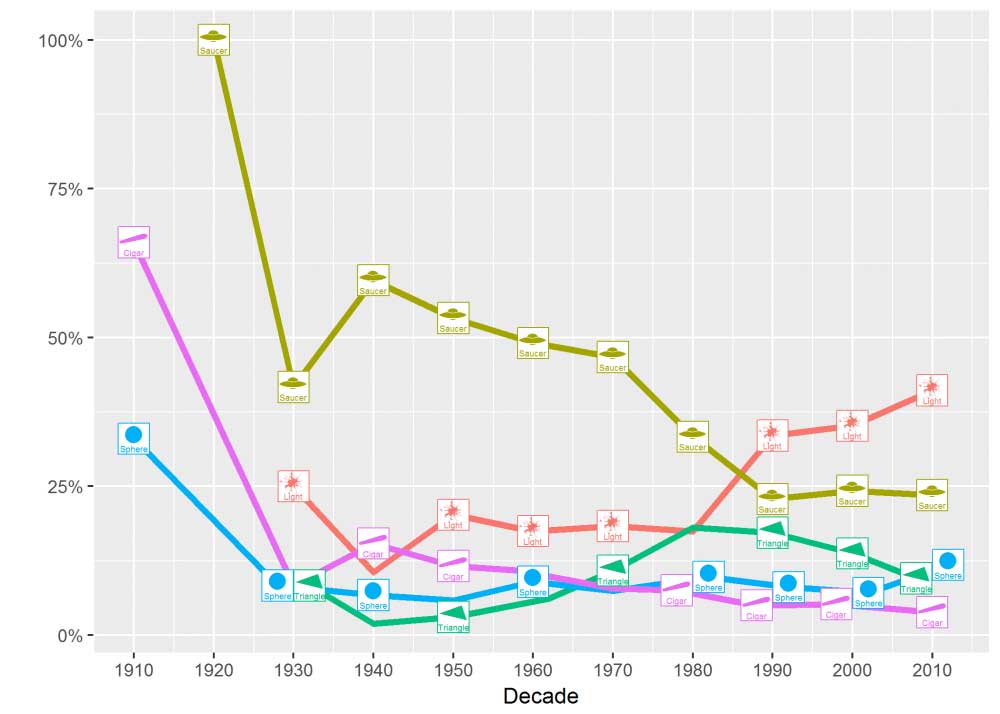
The types and frequency of UFO sightings since 1910 as measured and plotted by Monfort on his Visualize This blog. Image provided.
Sam Monfort noticed something about how professional baseball players are wearing their hats. Although most players used to wear curved brims, Monfort noticed more and more players wearing flat brims, the way they come new out of the box. He also noticed those players were younger than the ones wearing the curved brims.
Monfort decided to investigate. But when Monfort investigates something, the Human Factors and Applied Cognition PhD candidate at George Mason University plunges in head first, collecting reams of data, adjusting values, developing models and charting everything.
“When I see an interesting question that catches my eye, I go for it,” the Arlington, Va., native said. And much of the analyses he does on his blog—Visualize This—overlaps with the work he does on campus in his march toward his degree.
His research confirmed his suspicions: Older players prefer more curve in the brim.
Visualize This lives up to its description—“data visualization goulash”—as it offers up an intriguing assortment of statistical analyses of ponder-worthy topics. Shark attacks (he graphed about 5,000 attacks; yes, they are on the rise); how much electrical power households use during the holidays (electricity use surges about the time Santa is delivering presents); and how far a car will go once the gas gauge light comes on (Citroens do best).
Monfort’s visualizations got international exposure earlier this year when he found that UFO sightings are at an all-time high. He analyzed more than 104,000 UFO events dating to 1905. He even checked to see whether sightings spike around the fireworks-heavy Fourth of July (they do).
“I only posted a link on the Subreddit page ‘Data Is Beautiful,’” he said. From there the news hit multiple media outlets favored by enthusiasts of the paranormal, with mainstream media outlets such as USA Today, Fox News, National Public Radio and even Greece’s edition of the Huffington Post writing about the research.
“But I didn’t want to be known as the UFO guy,” Monfort added.
His latest post stemmed from recent federal rumblings of eliminating arts funding. Monfort created “Killing the National Endowment for the Arts: Race, Income and Arts Participation” to explore the relationship between public funds and participation in the arts. He also examined how cuts might impact white and non-white attendance of classical music concerts, ballet recitals, theater performances, jazz concerts, opera and other art forms.
Monfort’s topics may sometimes be whimsical, but his skill set is in serious demand.
“Sam's skills—like all my graduate student's skills—are in high demand today and will continue to be so for years to come,” says Patrick McKnight, who oversees George Mason’s Measurement Research Methodology Evaluation Statistics Lab.
“Sam has done a fine job of learning data analysis, effective communication and critical question formulation, as well as mastering the fundamental aspects of social and behavioral science. In short, Sam is well-positioned in any market he chooses to take his talents.”
For his part, Monfort would like to apply his passion for data with a tech company.
“I’d like to do something dealing with research design and problem solving,” he said. “It’s all about having a question you’re curious about.”